Three indicators forming one closed decision loop
Holographic decisions, trend momentum judgment and institutional behavior perspective — each module is powerful on its own and unstoppable together.
 Click to zoom
Intelligent Version
System Scout
Ultra-short-term · Swing · Range-bound trading modes are built into the Intelligent Version.
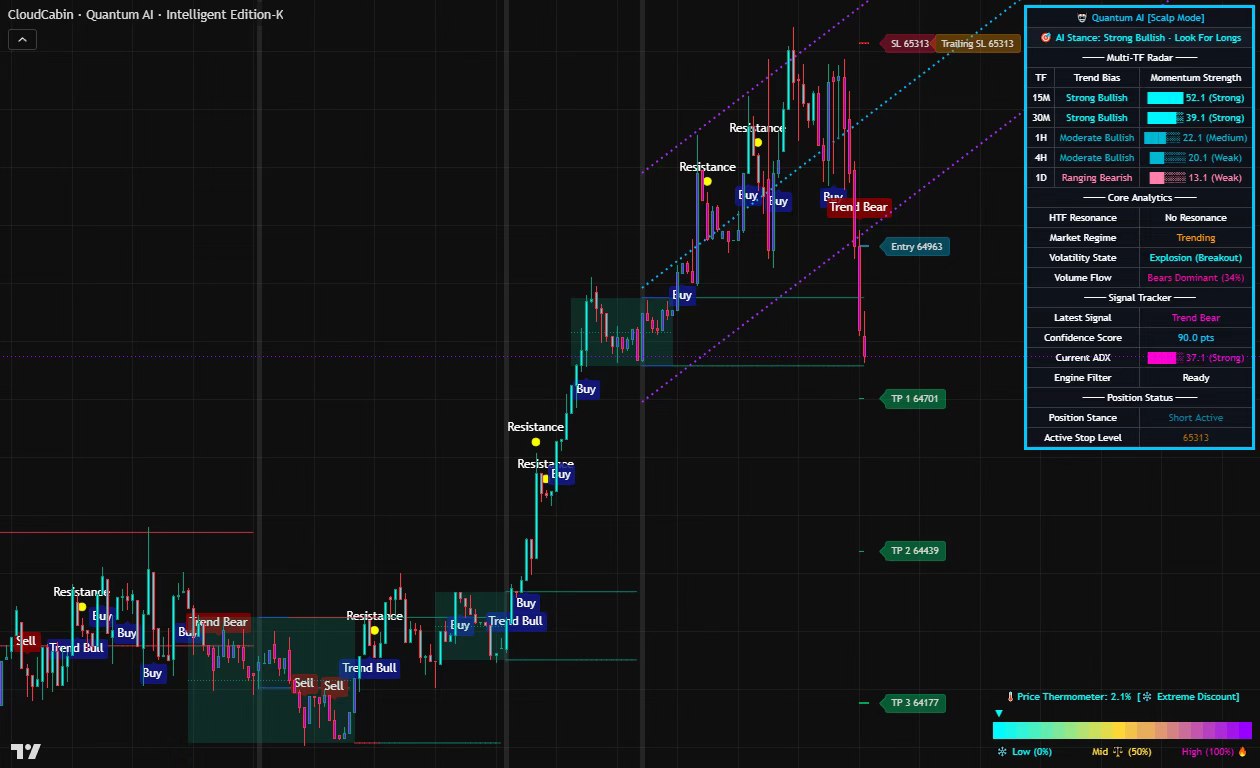
As the core of the entire trading system, it integrates quantum AI algorithms, a multidimensional decision-making engine, and a dynamic risk control system. It not only provides precise buy/sell signals but also conducts comprehensive, multi-factor analysis across the entire time horizon using powerful AI computing capabilities, serving as your ultimate trading decision support system.
- Quantum Nuclear Regression AI Algorithm (Nonlinear Price Curve) — Overcome the linear approach of lagging indicators like MA and MACD, fit price movements to nonlinear trajectories, and provide early signals of turning points. AI automatically identifies the dual market patterns of trend/range and dynamically adjusts parameters to perfectly adapt to all market conditions.
- Eight-tier rigorous filtering mechanism (eliminating 90% of false signals) — Three volatility levels | Trading volume intensity | Momentum limit | Momentum compression | Major cycle direction | Signal cooling | Structural inflection point | Volatility pattern. Multi-level filtering ensures high signal accuracy.
- Price Thermometer (Market Sentiment Visualization) — Use a cool-and-hot color chart to display the relative position of the current price among 50 K-lines. Extreme cold (blue) = oversold long zone, extreme hot (violet-red) = overbought short zone.
 Click to zoom
Resonance Distributor
System Commander
Using a unique dual-factor AI resonance algorithm, it generates signals only when the transaction distribution trend and the momentum trend move in the same direction. This approach effectively filters false breakouts based on a single dimension, serving as a critical step to enhance signal purity and prevent high-frequency false losses.
- Upper Hemisphere · Structural Trends — Using a cyan/violet background and oscillation lines, the system clearly identifies strong and weak zones for bulls and bears, filters out noise, and ensures stable and objective trend analysis.
- Lower Half Section · Dynamic Turning Point — The green/dark red momentum bar visually illustrates the shifting balance between bullish and bearish forces, precisely identifies critical turning points for buying/selling decisions, and ensures timely market entry.
- Core Competitive Advantage: AI-Driven Resonance Panel — Real-time aggregation displays the Transaction Distribution Status and Momentum Trend Status, while calculating and outputting the final Resonance Result, effectively eliminating meaningless market movements without clear trends.
 Click to zoom
Main Capital Monitoring
Smart Money (SMC) Tracker
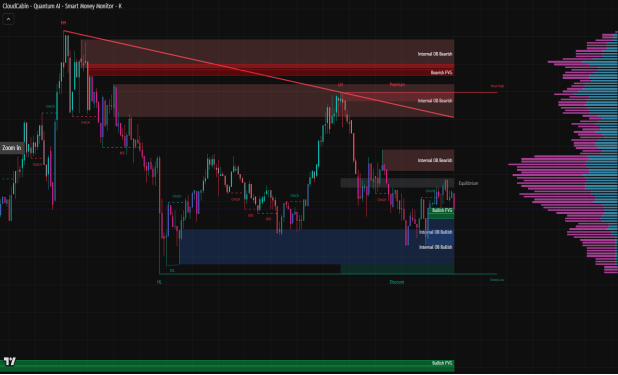
Deeply integrated with the world's leading Smart Money (SMC) trading theory, this system uses AI algorithms to automatically detect institutional investors' actions—including position building, price manipulation, price hikes, and sell-offs. It provides a clear visualization of major capital flows, seamlessly shifting your perspective from that of retail investors to that of institutional players.
- Smart Trendline — Using an advanced pivot point algorithm, it automatically identifies and plots valid ascending or descending trend lines, enabling precise determination of trend direction and key support/resistance levels without manual effort.
- Volume Profile — AI-powered intelligent statistics analyze trading volume distribution within a specified period, automatically identify key cost control lines (VAH/VAL) for major players, and help you precisely pinpoint their position-building cost zones as well as critical support and resistance levels.
- Smart Money (SMC) Panorama — It deeply integrates the world's top Smart Money (SMC) trading theory to automatically identify and mark key signals of major players' behavior such as BOS, CHoCH, OB, FVG.
The institutional language decoded on your chart
BOS, CHoCH, Order Blocks and Fair Value Gaps — automatically detected and annotated by the engine.
Market Analysis · Structural Breakthrough
The key indicators strongly confirm and sustain the current trend, indicating that market structure has been disrupted and trend momentum is robust and well-defined.
Trading Strategy · Follow the Trend
Once the BOS signal is confirmed, establishing a position aligned with the trend direction represents the optimal entry point to capture either the main upward or downward wave.
Market Analysis · Changes in Characteristics
These are early signals indicating an impending structural reversal in the trend. They suggest that the momentum of the existing trend is waning and market equilibrium has been disrupted.
Trading Strategy · Reversal Warning
As a potential reversal signal, it urges traders to immediately monitor the market, prepare to close their existing trend positions, and establish counterpositions.
Market Analysis · Institutional Grain Reserves
The price range formed during intensive position building or share exchanges by institutional investors constitutes the core cost zone and strategic base for major market players.
Trading Strategy · Precise Ambush
When prices retest the OB zone, they typically encounter strong support or resistance levels – making it an ideal entry point for setting low stop-loss orders and achieving high profit-to-loss ratios.
Market Analysis · Value Gap
The price vacuum zone created by major market players during rapid price surges or declines. The market inherently possesses the capacity to correct price imbalances, with an extremely high probability of such corrections occurring.
Trading Strategy · Cover Trading
Patience is key as prices adjust toward the FVG area; when they fill the gap and are supported by other confirmation signals, follow-through trades with high probability should be executed.