Not just metrics — the brain behind decisions
A built-in multidimensional analysis engine with millisecond-level response, deeply customized on TradingView.
Advanced Algorithms
Equipped with an exclusive quantum nuclear regression AI algorithm that predicts key resistance and support levels in advance.
Quantum Cloud Map
Quantitative trend slope and price variance range: accurately identifies the market movement range.
Periodic Resonance
Integrate all timeframes in real time for cross-cycle, multidimensional resonance confirmation.
Structural Mechanics Analysis
Intelligently identifies key order blocks, hub zone channels, and oscillating box structures.
Main Capital Reallocation
Go beyond the surface of K-line charts and use algorithms to accurately analyze the movements and intentions of major market funds.
Native TradingView Development
Deeply customized based on TradingView. The underlying architecture is more robust.
Over 5,000 K-Lines
Retrospective analysis of massive historical data to verify policy validity.
12 Main Core Modules
Built-in multidimensional analysis engine ensuring millisecond-level response speed.
Every capability across the three indicators
Intelligent Version
Holographic Decision TerminalBuilt-in System Modes
Ultra-short-term · Swing · Range-bound trading modes are built into the Intelligent Version.
Quantum Nuclear Regression AI Algorithm (Nonlinear Price Curve)
Overcome the linear approach of lagging indicators like MA and MACD, fit price movements to nonlinear trajectories, and provide early signals of turning points. AI automatically identifies the dual market patterns of trend/range and dynamically adjusts parameters to perfectly adapt to all market conditions.
Eight-tier rigorous filtering mechanism (eliminating 90% of false signals)
Three volatility levels | Trading volume intensity | Momentum limit | Momentum compression | Major cycle direction | Signal cooling | Structural inflection point | Volatility pattern. Multi-level filtering ensures high signal accuracy.
Price Thermometer (Market Sentiment Visualization)
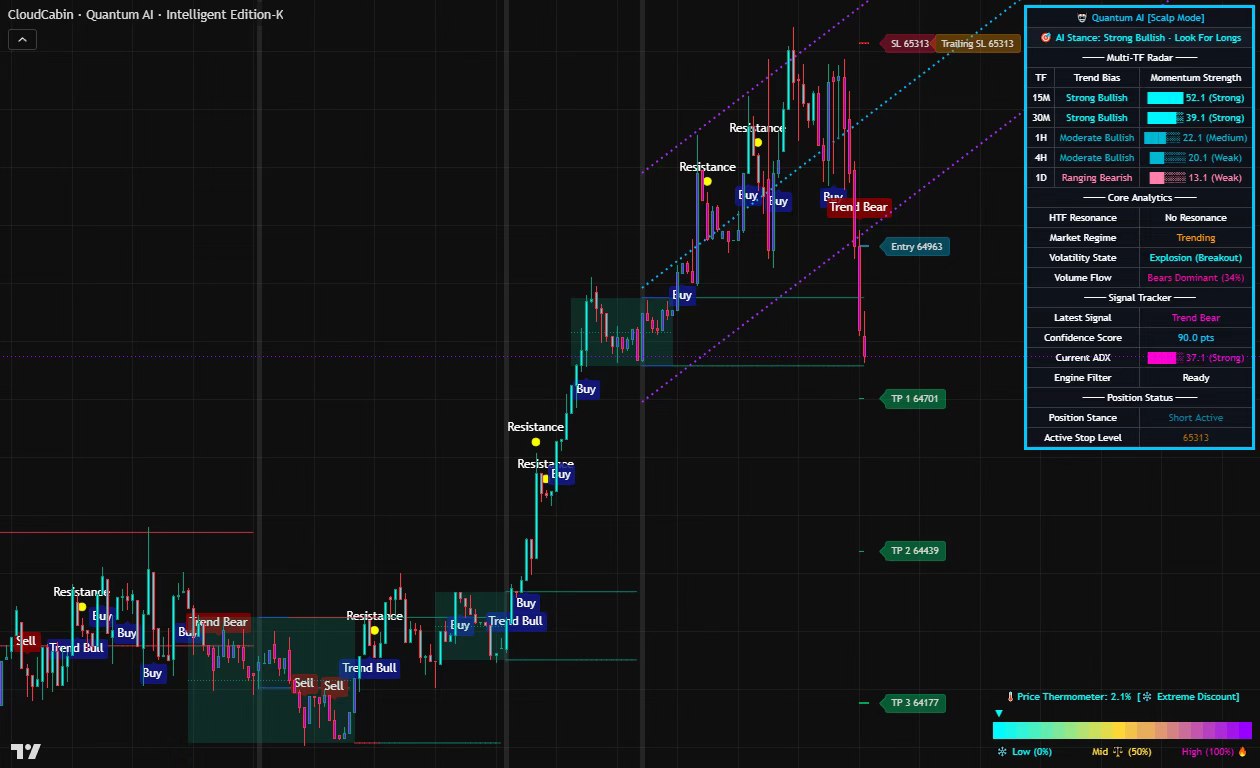
Use a cool-and-hot color chart to display the relative position of the current price among 50 K-lines. Extreme cold (blue) = oversold long zone, extreme hot (violet-red) = overbought short zone.
Cross-cycle Matrix
Real-time integration and monitoring of trend consistency across all timeframes. When trends align across multiple timeframes, a strong cross-cycle resonance emerges, signaling a trend-driven market movement with high probability of success. Clearly address common misconceptions about counter-cyclical trading, logically eliminate counter-trend trades, and ensure the strategy's accuracy.
Energy Balance & Capital Flow
Quantify the current balance of bullish and bearish forces in the market, visually displaying the dominant strength of bulls or bears as percentages to help you gauge market sentiment. When the system signal direction aligns closely with the primary capital flow indicated by the energy balance, it significantly enhances both the reliability of trading signals and the expected profit-to-loss ratio.
Real-Time Volatility Pattern Monitoring
Monitor four volatility states in real time: compression, stable, explosive, expansion. Pattern quality is better during explosive and expansion states.
Volume Balance
Monitor bullish and bearish trading volume in real time.
AI Signal Strength Score (0–100)
Each trading signal undergoes comprehensive scoring by AI algorithms, with the following factors taken into account: volatility, trading volume, trend strength, structural position, cyclical resonance coefficient, etc. Set 60 points as the high-confidence entry threshold, condensing complex market analysis into intuitive quantitative indicators to lower decision-making barriers.
Resonance Distributor
Trend Momentum JudgmentUpper Hemisphere · Structural Trends
Using a cyan/violet background and oscillation lines, the system clearly identifies strong and weak zones for bulls and bears, filters out noise, and ensures stable and objective trend analysis.
Lower Half Section · Dynamic Turning Point
The green/dark red momentum bar visually illustrates the shifting balance between bullish and bearish forces, precisely identifies critical turning points for buying/selling decisions, and ensures timely market entry.
Core Competitive Advantage: AI-Driven Resonance Panel
Real-time aggregation displays the Transaction Distribution Status and Momentum Trend Status, while calculating and outputting the final Resonance Result, effectively eliminating meaningless market movements without clear trends.
Factor 1: Distribution Trend of Success Rate
Analyze the trading intentions and strength dynamics between bulls and bears to assess market stability and solidify trading fundamentals. Provides the directional basis of the two-factor resonance logic closed loop.
Factor 2: Kinetic Trend
Identify the acceleration and turning points of price fluctuations to ensure precise entry timing and accurately pinpoint the starting point. Provides timely execution within the two-factor resonance logic closed loop.
Resonance Result
The AI panel only triggers the final signal when the Transaction Distribution aligns with the direction of the Momentum Trend: [Resonant Long] / [Resonant Short]. This mechanism can accurately filter out over 90% of false breakouts and invalid trading signals, significantly improving the actual win rate.
Main Capital Monitoring
Perspectives on Institutional BehaviorSmart Trendline
Using an advanced pivot point algorithm, it automatically identifies and plots valid ascending or descending trend lines, enabling precise determination of trend direction and key support/resistance levels without manual effort.
Volume Profile
AI-powered intelligent statistics analyze trading volume distribution within a specified period, automatically identify key cost control lines (VAH/VAL) for major players, and help you precisely pinpoint their position-building cost zones as well as critical support and resistance levels.
Smart Money (SMC) Panorama
It deeply integrates the world's top Smart Money (SMC) trading theory to automatically identify and mark key signals of major players' behavior such as BOS, CHoCH, OB, FVG.
Institutional actions, fully automated
The system automatically identifies key trading actions in a fully automated manner, directly elevating the perspective of retail investors to that of institutional investors. Position building, shakeouts, price hikes and sell-offs are marked directly on the chart.
 Click to zoom
18 specialized alarm types, delivered anywhere
Comprehensive Coverage for All 18 Types of Specialized Alarm Systems
It covers key signals including price triggers, channel breakouts, resistance breakdowns, BOS/CHoCH confirmations, and order block breakthroughs. It comprehensively identifies trading opportunities and mitigates potential risks.
Seamless Integration With Webhook Real-Time Notifications
It fully supports the TradingView Webhook feature, delivering alerts directly to multiple channels including Telegram, Discord, email, and SMS, ensuring you never miss a single alert.
The Preferred Choice for Office Workers and Non-Professional Traders
The AI algorithm serves as your round-the-clock sentinel, eliminating the need for prolonged market monitoring and effortlessly balancing work-life commitments with trading rhythms.